
Estimating risk
Security is about managing risk, rather than avoiding threats. Because of this, a lot of attempts have been made to quantify risk. Some of these have turned out to be unusable because of their sophistication. Monte Carlo risk analysis, for example, was widely looked on some years ago as an appropriate risk- management tool: All you had to do was pick a probability distribution curve, plug in the right parameters, and voila! you were in business.
Unfortunately, there were dozens of probability curves from which to choose, and most users were familiar with only a few, which meant the probability of choosing the right one was somewhere between slim and none. And the probability of choosing the appropriate parameters was roughly on the same level.
In spite of this, however, being able to quantify risk is still desirable, even if you couldn’t be as sophisticated as you would like. An approach to this was shown at the National OPSEC Conference by Beta Analytics International, Inc., based on the traditional formula of
RISK = IMPACT × PROBABILITY
which breaks down, for our purposes, to
RISK = IMPACT × THREAT × VULNERABILITY
We are giving here a brief overview of the process. Keep in mind that OPSEC is a process, not a formula, and that use of these tools is part of an iterative process. Also keep in mind that you may have different adversaries, and that risk analysis has to be done against specific adversaries.
Step one is to identify the various individual pieces of the assets you wish to protect, and from whom you wish to protect it. Remember that a project can have lots of steps and pieces, and that each piece can be vulnerable in a wide variety of ways, with there being multiple indicators pointing to potentially vulnerable areas. Each of these must be evaluated separately.
Step two is to classify the IMPACT of the compromise of each of these pieces as:
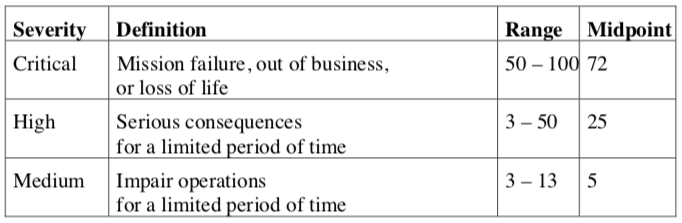
![]()
Step three is to rate the THREAT to each of these pieces as:
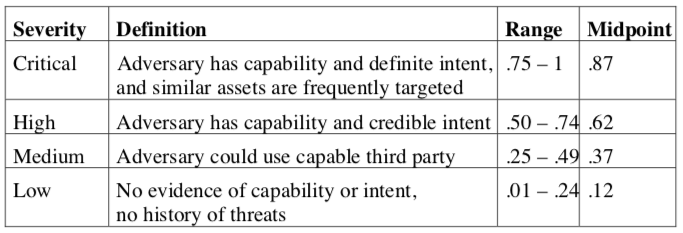
Step four is to rate the VULNERABILITY of each of these pieces as:
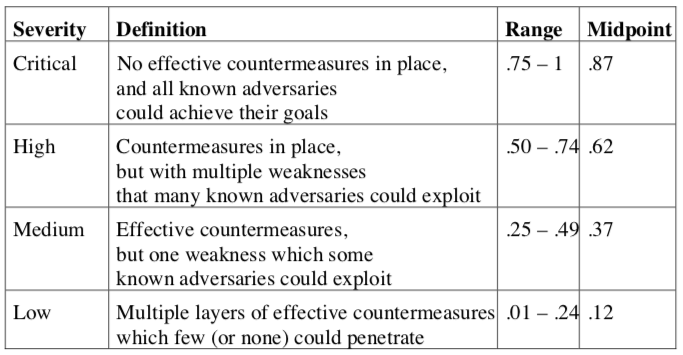
With these factors, you can build a table that will alloy you to compare perceived risk (RISK = IMPACT × THREAT × VULNERABILITY), which in turn should allow you to have a more-solid basis with which to make decisions on how to manage risk.
There is a tendency, once numbers are produced, to believe them because the are in printed form. In the computer business this is called GIGO — Garbage In; Gospel Out. Please remember that the numbers themselves are not determining factors, merely an indicator. By this I mean both that someone needs to be able to judge whether the numbers make sense. It also means that you may decide that a lower overall risk associated with a high IMPACT may be more important than a higher risk associated with a lesser IMPACT. This is a tool: You are the decision maker. Use it as a tool.
